Population of El Salvador
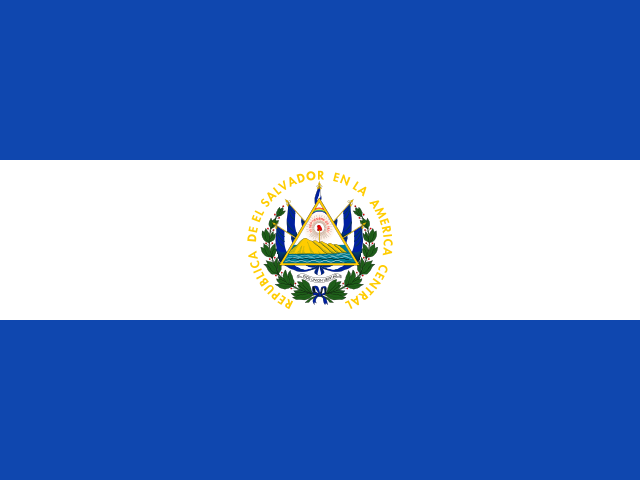
As of October 2026, the population of El Salvador is 6.4 million. The number of inhabitants has increased by 25 thousand in the last year, representing a growth of 0.40%. The median age of the population has increased in recent years, rising from 24.2 years in 2016 to 28.4 years in 2026. Currently, life expectancy at birth is 72.7 years and population density is 308.5 inhabitants per square kilometer.
Loading…
Couldn’t load. Please try again.
No results
You can compare up to 5 countries. Remove one to add another.
Population Growth
The population growth rate of El Salvador peaked in 1966, reaching around 2.83% annually, but has since declined to approximately 0.4% in 2026. The annual increase in the number of people has also decreased from a peak of around 105.42 thousand in 1988 to nearly 25.3 thousand in 2026.
Loading…
Couldn’t load. Please try again.
No results
You can compare up to 5 countries. Remove one to add another.
Life Expectancy
In El Salvador, life expectancy at birth has been increasing, with the indicator rising from 69.6 years in 2006 to 72.7 years in 2026, representing an increase of more than 3 years over the past 2 decades.
Loading…
Couldn’t load. Please try again.
No results
You can compare up to 5 countries. Remove one to add another.
Most populous cities in El Salvador
The cities of El Salvador are mostly small, but 7 stand out with more than 100 thousand inhabitants. The most populous city is San Salvador, San Salvador Department, with approximately 526 thousand inhabitants. It is followed by Soyapango, San Salvador Department with 329.7 thousand and San Miguel, San Miguel Department with 247.1 thousand.
These are the 20 most populous cities in El Salvador:
| # | City | Population |
|---|---|---|
| 1 | San Salvador, San Salvador Department | 525,990 |
| 2 | Soyapango, San Salvador Department | 329,708 |
| 3 | San Miguel, San Miguel Department | 247,126 |
| 4 | Santa Ana, Santa Ana Department | 176,661 |
| 5 | Mejicanos, San Salvador Department | 160,317 |
| 6 | Santa Tecla, La Libertad Department | 124,694 |
| 7 | Apopa, San Salvador Department | 112,158 |
| 8 | Delgado, San Salvador Department | 71,594 |
| 9 | Sonsonate, Sonsonate Department | 59,468 |
| 10 | San Marcos, San Salvador Department | 54,615 |
| # | City | Population |
|---|---|---|
| 11 | Usulután | 51,910 |
| 12 | Cojutepeque, Cuscatlan | 48,411 |
| 13 | Cuscatancingo, San Salvador Department | 44,369 |
| 14 | San Vicente, San Vicente Department | 41,504 |
| 15 | Zacatecoluca, La Paz Department | 39,613 |
| 16 | San Martín, Cuscatlan | 39,361 |
| 17 | Ilopango, San Salvador Department | 38,890 |
| 18 | Ahuachapán | 34,102 |
| 19 | Antiguo Cuscatlán, La Libertad Department | 33,767 |
| 20 | Chalchuapa, Santa Ana Department | 32,282 |